
High System Load with Low CPU Utilization. How?
Hi everyone,
Hope you’re doing good!
I’m working for a client doing some proactive job to check about performance along the time.
I always start a job like this using eDB360. You can check more details about this amazing tool here.
I ran eDB360 for the most critical databases in the environment. This is a environment with some SAP applications and also some systems developed by big companies.
I start analyzing eDB360 output. I always start the analyzis in the first sections of eDB360, and then, after some time, I analyzed Section 3, regarding OS statistics:
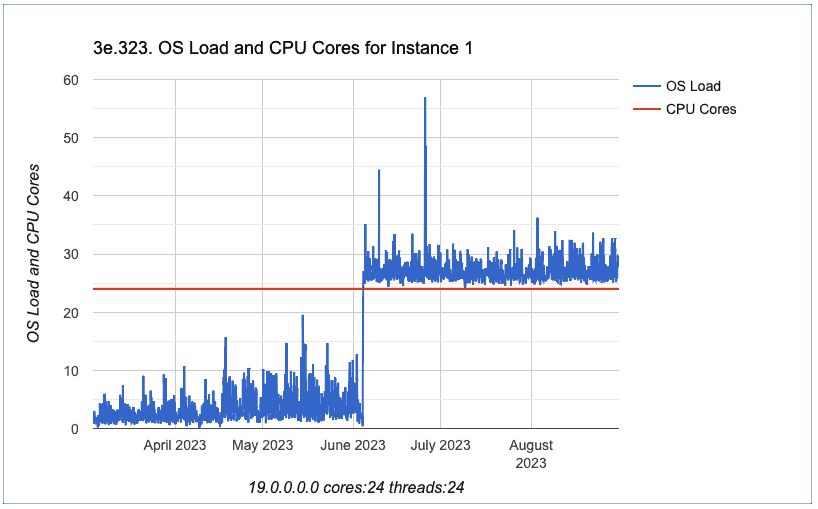
After this, I verified the chart identified by ID 323: “OS Load and CPU Cores for Instance 1”
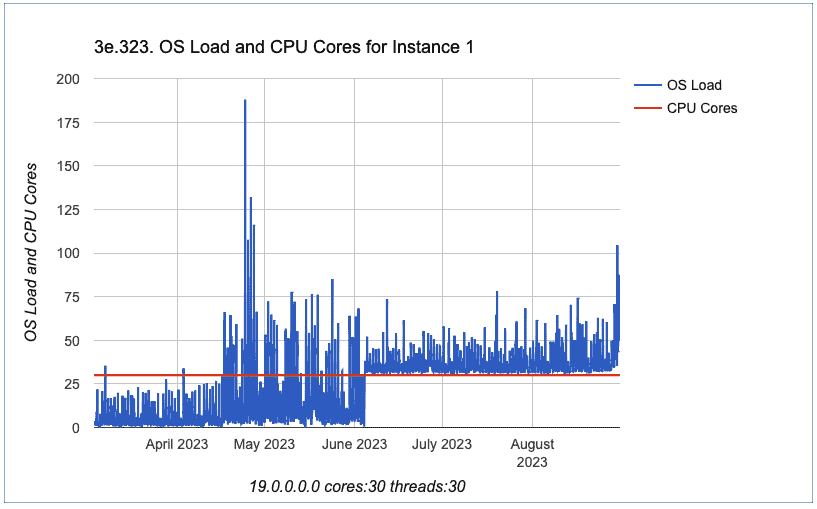
When I saw this, my reaction was like: wow!
We can clearly see that after earlier June, we have an increase on OS Load. OS Load increased and never went down to the values we had before June.
So, I analyzed other charts about CPU, all of them from Section 3 from eDB360.
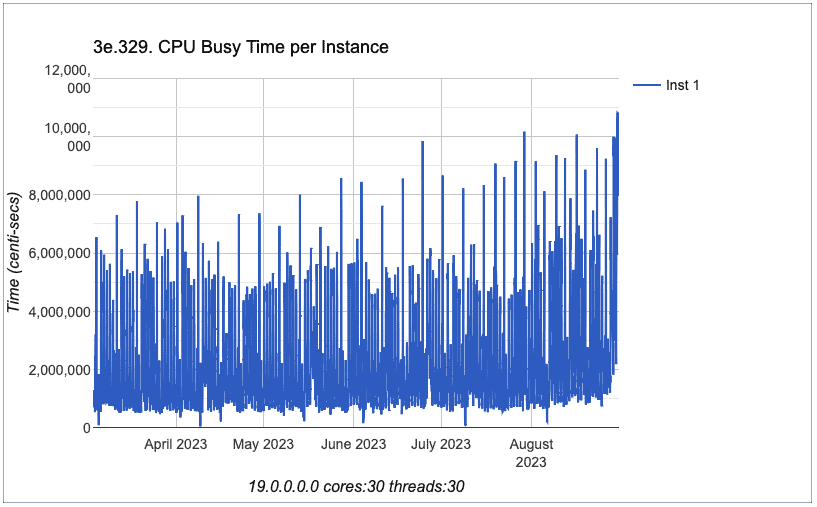
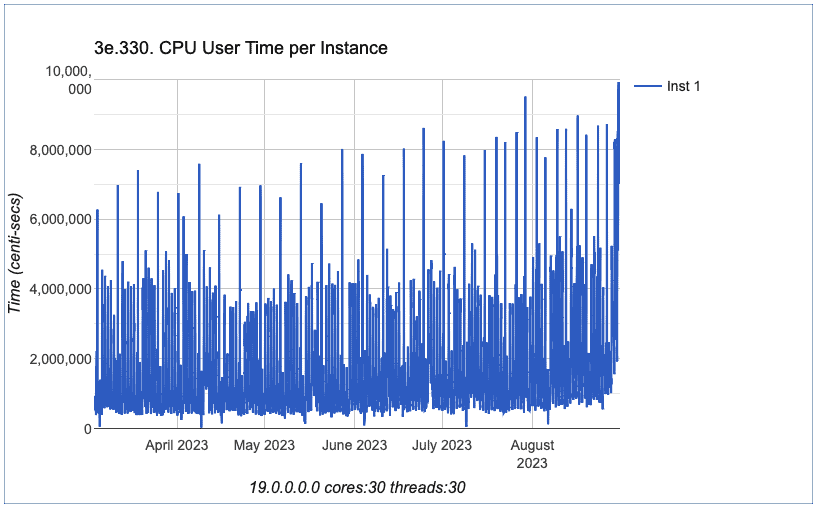
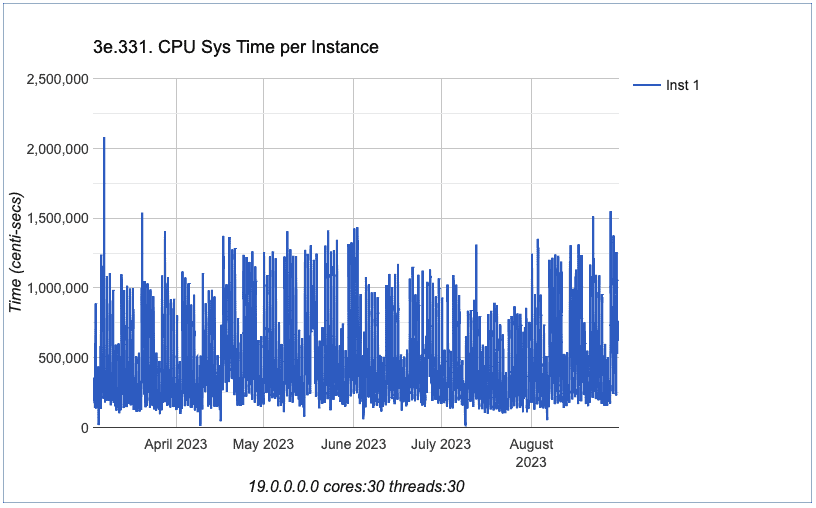
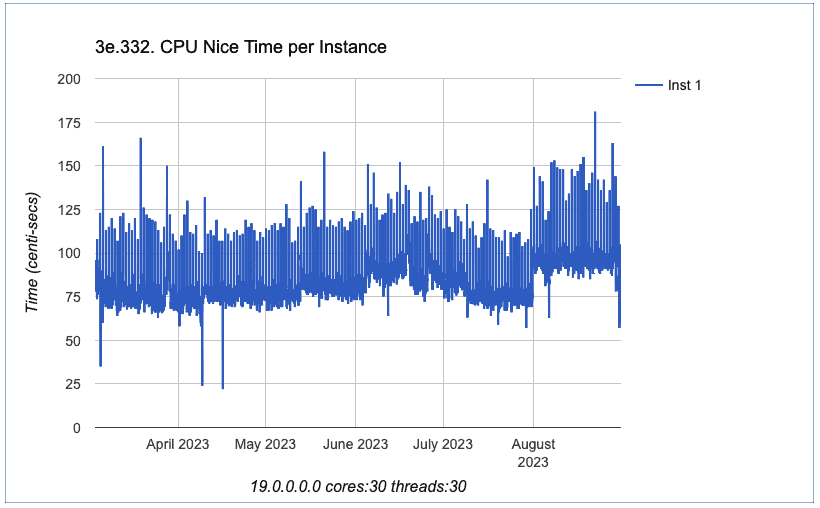
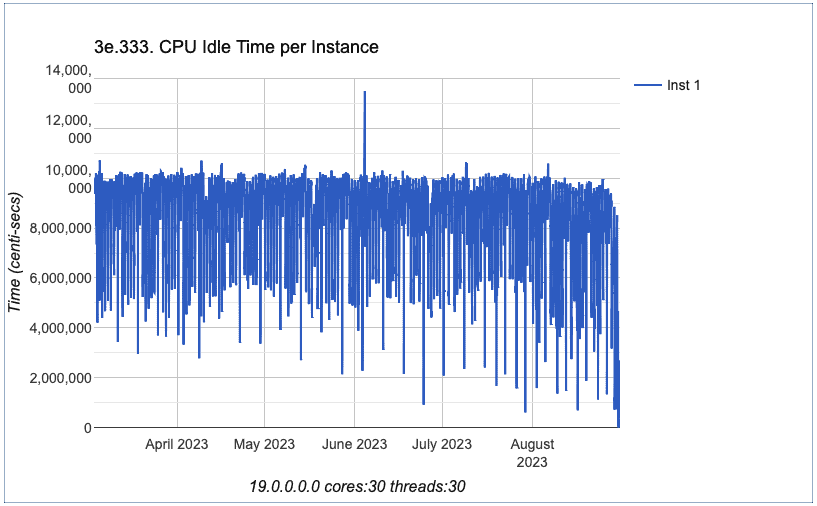
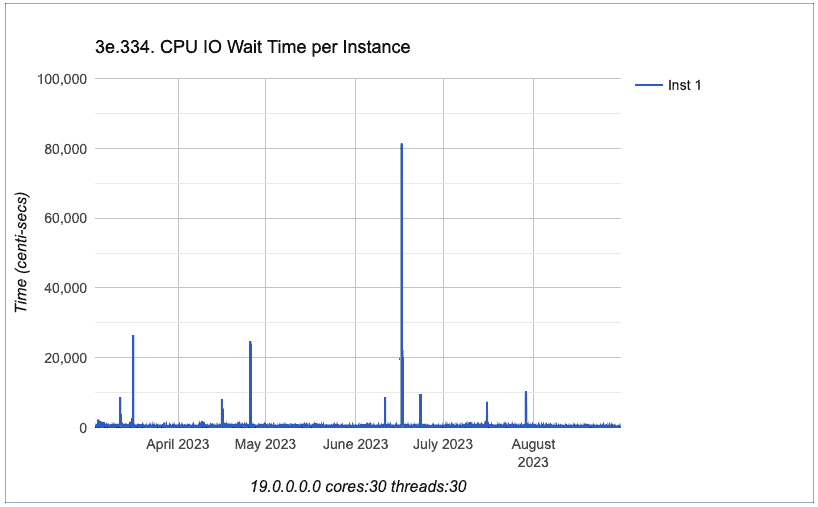
OK, we can conclude that all charts exhibited above don’t have a spike beginning on June 4th. In fact, we can conclude that all CPU charts exhibited have a similar behavior in terms of performance. The trend did not change.
Checking through the Oracle Enterprise Manager metrics chart:
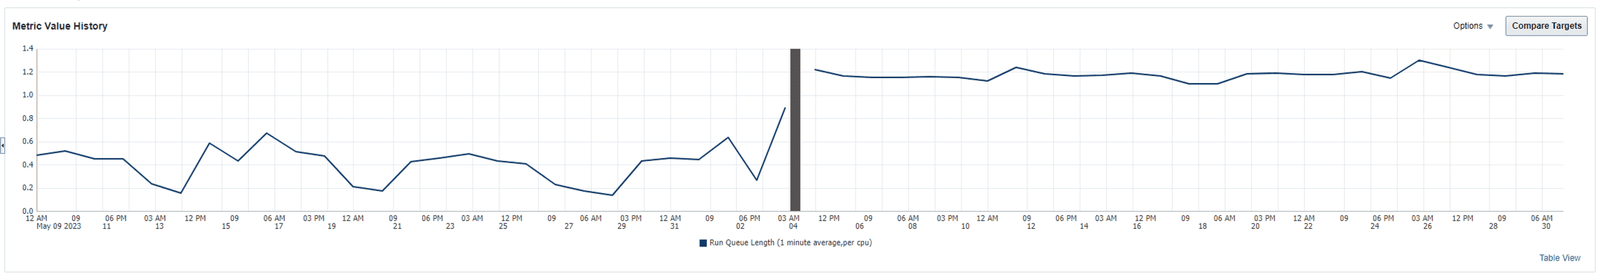
Yes, confirmed that load increased after June 4th.
Can you see that we have a dark grey bar before the load average increased?
This dark grey bar means an OEM blackout. Interesting, isn’t? 🙂
OK, let’s proceed with our investigation here…
So, what does mean the OS load?
According with Red Hat documentation:
The load average is a number corresponding to the average number of runnable processes on the system. The load average is often listed as three sets of numbers, which represent the load average for the past 1, 5, and 15 minutes.
For this issue, a blog post from Tanel Poder also was very useful. In fact, it was a game changer! Thank you Tanel!
You can check his blog post here: High System Load with Low CPU Utilization on Linux?
On his blog post, there is also a good explanation about OS load:
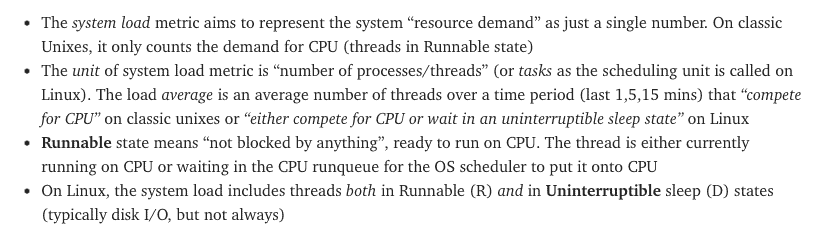
OK, load can be related to Runnable processes (usually using CPU), but also can be related to Uninterruptible sleep state processes!
So, we started a drill down in OS to check further. The server name was changed due security reasons! 🙂
sar -u 5
Let’s check output from sar
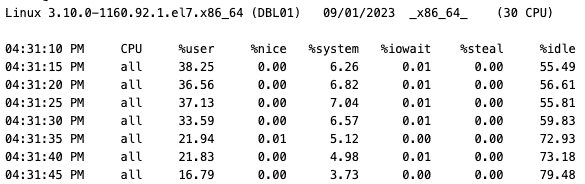
From sar we can clearly identify that CPU usage never exceed 45%! Which confirms the previous charts exhibited here on my blog post.
Next step is to check what (and who) is contributing to OS load:
ps -eo s,user | grep ^[RD] | sort | uniq -c | sort -nbr | head -20
30 D root
2 R orape1
1 R root
We can see that we have 1 process in Runnable state owned by root, 2 processes in Runnable state owned by user orape1 (oracle user) and 30 processes in Uninterrupted sleep state owned by root. Interesting, isn’t?
Let’s drill down and see what are those processes:
ps -eo s,user,cmd | grep ^[RD] | sort | uniq -c | sort -nbr | head -45
1 R root ps -eo s,user,cmd
2 R orape1 oraclePE1 (LOCAL=NO)
1 D root [llt_hb/9]
1 D root [llt_hb/8]
1 D root [llt_hb/7]
1 D root [llt_hb/6]
1 D root [llt_hb/5]
1 D root [llt_hb/4]
1 D root [llt_hb/3]
1 D root [llt_hb/29]
1 D root [llt_hb/28]
1 D root [llt_hb/27]
1 D root [llt_hb/26]
1 D root [llt_hb/25]
1 D root [llt_hb/24]
1 D root [llt_hb/23]
1 D root [llt_hb/22]
1 D root [llt_hb/21]
1 D root [llt_hb/20]
1 D root [llt_hb/2]
1 D root [llt_hb/19]
1 D root [llt_hb/18]
1 D root [llt_hb/17]
1 D root [llt_hb/16]
1 D root [llt_hb/15]
1 D root [llt_hb/14]
1 D root [llt_hb/13]
1 D root [llt_hb/12]
1 D root [llt_hb/11]
1 D root [llt_hb/10]
1 D root [llt_hb/1]
1 D root [llt_hb/0]
All the 30 processes in Uninterrupted state are related to same bad guy: llt_hb
Doing some research, I found this:

Hummm, on this knowledge document from Red Hat support there is a reference for an article on Veritas site:
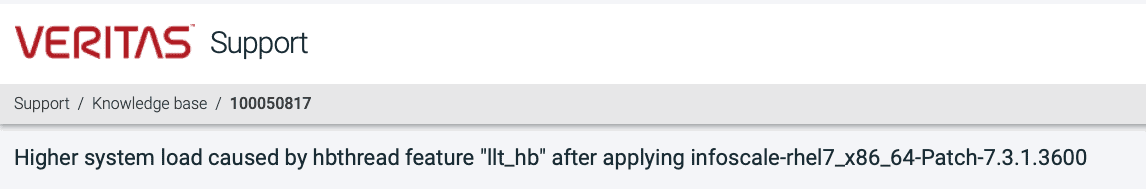
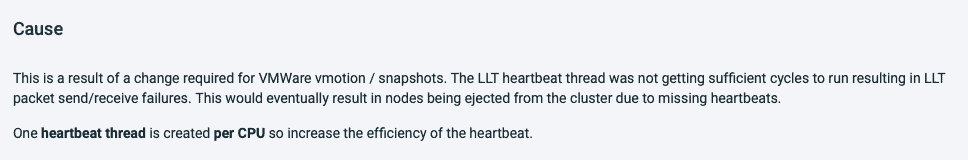
We also have this on this article:
“The load average increases to approximately the number of CPU’s installed on the system. Here is an example on an 8 CPU server.”
Let’s try to identify about the package which have this process:
rpm -qa |grep llt
VRTSllt-8.0.0.0000-RHEL7.x86_64
Great, let’s now see more details about the package:
rpm -qi VRTSllt
Name : VRTSllt
Version : 8.0.0.0000
Release : RHEL7
Architecture: x86_64
Install Date: Sun 04 Jun 2023 08:29:28 AM UTC
Group : Applications/System
Size : 83286225
License : Veritas Proprietary
Signature : RSA/SHA1, Mon 22 Nov 2021 04:49:39 PM UTC, Key ID 4e84af75cc633953
Source RPM : VRTSllt-8.0.0.0000-RHEL7.src.rpm
Build Date : Mon 01 Nov 2021 06:42:01 PM UTC
Build Host : vcsrsvrhel7bld1.rsv.ven.veritas.com
Relocations : (not relocatable)
Packager : enterprise_technical_support@veritas.com
Vendor : Veritas Technologies LLC
URL : www.veritas.com/support
Summary : Veritas Low Latency Transport
Description :
Veritas Low Latency Transport (LLT) Driver and commands for Linux
Supported kernel(s): 3.10.0-862.el7.x86_64 3.10.0-957.el7.x86_64 3.10.0-1062.el7.x86_64 3.10.0-1127.el7.x86_64 3.10.0-1160.el7.x86_64 [LINUX_RHEL70]
Build Stamp: Veritas-8.0.0.0000-2021-11-01_12.48.55
Can you all noticed that?
Install Date: Sun 04 Jun 2023 08:29:28 AM UTC
This matches when we started seeing OS load increase!
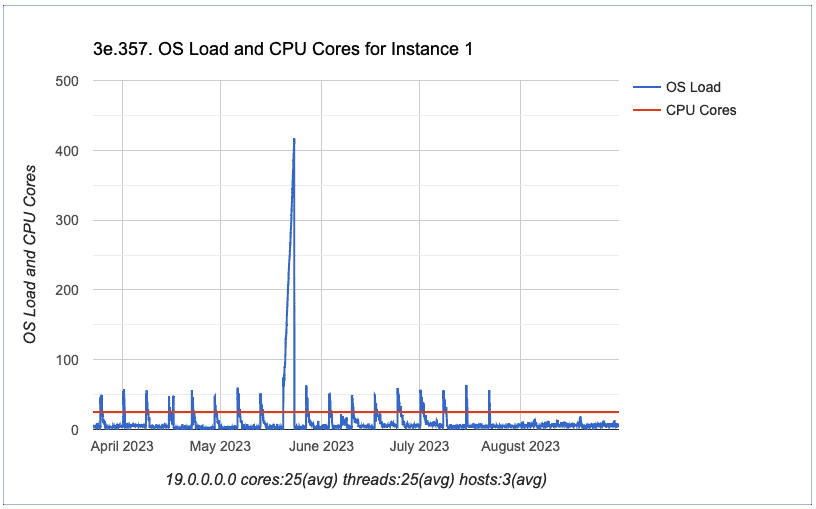
As I mentioned earlier, this environment have some SAP apps, for all Production DB’s used by SAP they have Veritas clusters configured. We checked all servers with Veritas cluster (even the application servers), and the behavior is the same, example:
We also verified another server where we have Oracle RAC / Grid Infrastructure as cluster solution, for this RAC server we don’t have the OS load increase. So, this is indeed an issue specific to Veritas.
We shared all those details with Linux team and they raised a high priority case with Veritas. So, a new patch will be released or they will ask to change some configuration for this specific process.
Hope this helps!
Peace!
Vinicius
Leave a comment